Just because Scott Brinker’s newest version of the Marketing Technology Landscape looks like a Map of the Seven Kingdoms, don’t hack through it like a White Walker pillaging Westeros if you’re on the march for a new piece of martech.
There is, alas, a better way.
According to Tony Byrne, founder of Real Story Group, the answer lies in applying design thinking to the process.
“It’s a human-centered approach to innovation, which means that really people have to be at the center of it, whether they’re your marketing colleagues, or whether they’re your customers,” said Byrne, who discussed design thinking as it applies to buying marketing technology during his Discover MarTech keynote.
Step 1: Empathize
The key to the first phase is to create diverse user stories that capture not only the range of use-cases for a given technology, but more importantly filtered those through the lens of the various personas who interact with that tech. According to Byrne, it’s important that these user stories aren’t centered around features of the technology. It’s about the people.
“The key thing here is to describe, rather than prescribe,” he said. “You don’t say someone hits the green button in the upper right-hand corner. Instead of you say ‘Delia, the marketer, should be able to create a segment based on the following categories and deploy that segment to her email service platform.’”
Step 2: Define
Once you have your user stories in place, now it’s time to build your RFP and vendor shortlist. But Byrne cautions against doing so the old fashioned way.
“The best way to encapsulate this, instead of long lists of requirements, is around actual user stories,” he said. “You create more definition by putting together some sort of RFP that has those user stories as well as advanced questions for vendors.”
According to Byrne, you should never list your requirements, but instead put them in terms of questions for vendors.
As for coming up with a vendor shortlist, there is no shortage of options to do that kind of research. For example, you may want to start with MarTech Today’s buyer’s guides.
“The goal here is that the shortlist could be as short or as long as it needs to be,” said Byrne. It’s the next step where you can start to narrow down the list.
Step 3: Ideate
The key focus here is to gather your vendor proposals, narrow them down and proceed to the demo phase.
The first step is the ask the vendors on your shortlist to send in proposals, based on the questions you had gathered in the requirements phase above. Then, after some back and forth with vendors, it’s time to invite the ones on your narrowed-down list to demo for your team.
And that’s an important element, Byrne said. “Make sure your full selection team is represented. You all want to be around the table here.”
When it comes time to view the demo, make sure the vendor is not running a canned presentation and instead should cater to the unique user stories you created and shared with them during the RFP process.
Once the demo is over, Byrne recommends taking a short break to really think about the final questions you want to ask the vendor.
“You may find that some of the things that you thought were problematic are actually easily resolvable. In other cases, you may find that something that you think was a not serious shortcoming actually is worse than you thought,” he said.
And don’t forget to ask the tough questions around pricing, licensing, user experience and even the lack of depth the vendor may have in your particular industry segment. It’s important to get those answers on the spot, while you are in the same room with the vendor.
Step 4: Prototype
Once you’ve been impressed or, at least, further interested by a demo, it’s time to put it to real scenarios. That means getting your hands on the platform yourselves.
“It may be a sandbox, because we’re not talking about a production environment,” he said. “And you may need to spend the first two-and-a-half days doing training and education. But then you spend the rest of the week actually executing on your scenarios.”
“This is the best way to find out if the technology is the right fit. If the vendor is the right fit.”
Byrne said some vendors may push back on the idea of giving you a prototype, but it is important to make clear how important an investment this is for your company.
Also, running a prototype like this will certainly come with costs, so it’s important to be upfront with the vendor that you will want a prototype, or “bake-off” round as Byrne calls it.
“So what you do is in the upfront RFP you signal to the vendor that there’s going to be a bake-off round, if you make it that far,” he said. That’s when you ask how much they would charge for that, since it is still a very competitive situation for them.
“Hopefully they’ll give you a reasonable amount,” he said, adding that this is also something that you can negotiate against.
Rip and replace
The methodology Byrne advocates for comes at a time when many marketers are looking to buy new tools to replace their existing platforms.
In fact, we surveyed nearly 400 marketers in the fall and found 83% had replaced a piece of their stacks in the past year. In nearly half the cases, marketers were replacing homegrown applications. But the other half ripped out 3rd party platforms in favor of new tech that better met their needs.
When asked why marketers were replacing technology, it was evenly split between better features, integration and costs.
Step 5: Test
The last step in Byrne’s approach is optional, but it involves analyzing the product life-cycle of the technology you are thinking about purchasing and trying to determine whether it is a good time to buy it.
The testing phase is also about looking at how the platform truly fits into your life-cycle.
“You want to understand where that technology is going, it’s going to fit in the stack of your future,” he said. “And in the stack of your future, you’re likely to get kind of lighter and more agile at the engagement tier, and probably more serious and complex at the enterprise foundation tier where you can share services and data across these different kinds of engagement platforms now.”
If you take away nothing else, Byrne said to remember buying martech is an agile process.
“You start out with imperfect user stories, imperfect questions for vendors, but you’re going through an iterative process here with proposals, demos, bake-offs, maybe a final PLC after that,” he said.
“But you’re refining those stories over time as you learn more around what works for you, what doesn’t and you’re testing at each step of the process.”
About The Author
Henry Powderly is vice president of content for Third Door Media, publishers of Search Engine Land, Marketing Land and MarTech Today. With more than a decade in editorial leadership positions, he is responsible for content strategy and event programming for the organization.
Johnson & Johnson CEO Alex Gorsky has said that the COVID-19 pandemic is one of the most significant events ever experienced.
Pharma search engine marketers want answers to these key questions – “How are these shifts impacting the search messaging landscape? How to adapt SEM campaigns to remain relevant to shifting patient/provider needs and stay competitive in the search auction?”
Ian Orekondy shares insights from AdComplyRx analysis of 50k+ SEM text ads from over 500 prescription treatment brands serving on thousands of keywords.
The analysis showed that copy messaging with search terms like “savings” and “coverage” has rapidly risen.
He highlights some quotes from industry veterans to help paid search marketers gain clarity on these conundrums.
Johnson & Johnson CEO Alex Gorsky said on Tuesday’s earnings call that the worldwide COVID-19 pandemic is “one of the most significant events that any of us have ever experienced”.
It has caused more than 120,000deaths and is impacting every industry, especially the pharmaceutical sector.
According to IQVIA’s ‘COVID-19 Market Report’, published April 10th with data through March 27th, “increasing unemployment pushes more patients onto Medicaid and into economic fragility. [Likewise], providers are financially strained due to decreased visits, reduced elective surgeries, and lower reimbursement rate [and] many pharma companies are expanding patient support in response to the COVID-19 crisis…with free branded drugs through Patient Assistance Programs…and copay reduction & patient savings programs.“
These companies include Pfizer, Johnson & Johnson, Allergan, Lilly, Bristol-Myers Squibb, Abbvie, and more.
So the question for pharma search engine marketers is?
How are these shifts impacting the search messaging landscape?
And how do we adapt our campaigns to remain relevant to shifting patient/provider needs and stay competitive in the search auction?
To help answer this question, AdComplyRx analyzed over 50k SEM text ads from over 500 prescription treatment brands serving on thousands of keywords (condition, treatment and brand terms) comparing the frequency of mentions of various pandemic-relevant messages over two time periods: 4/1-4/13 (post-stay-at-home orders) vs 3/1-3/13 (pre-stay-at-home orders).
Pharma search ads shift to “savings” and “coverage” amid COVID-19 pandemic
Since Google’s ad policyrestricts ad messages containing terms like COVID-19 or Coronavirus, AdComplyRx also measured terms like “cost”, “savings”, “co-pay”, “supply chain”, “availability”, “fill”, and “delivery”in terms of frequency of mention within paid search (SEM) text ad copy from prescription drug brands in the U.S.
Based on this analysis, AdComplyRx is observing the following shifts in Rx Pharma SEM advertising during the COVID-19 pandemic.
Mentions of “savings” grew by 11%
These included “savings card”,“co-pay card savings”, “patient savings, register for savings.
Mentions of “coverage”grew by 40%
These included “insurance coverage” and “formulary coverage”saw the most significant increases in the frequency of mentions within Rx pharma brand SEM text ads.
Category-level insights
The top categories that showed the greatest increase in the frequency of the words “savings” or “coverage” were Hematology, Diabetes and Respiratory.
The Oncology category showed little change in the frequency of any of these messages during these time periods.
Mentions of “savings” in paid search (SEM) ad copy messaging
Haematology (+96%)
Diabetes (+48%)
Mentions of “coverage” in paid search (SEM) ad copy messaging
Respiratory (+184%)
Haematology (+156%)
Since it is unlikely most pharma brands have already created new search ad messages and received approval from their med-legal team, this data suggests that Google’s advertising platform may be dynamically adjusting existing pharma brand search campaigns to better serve patients and providers based on theirsearch behaviour (for example, search interest and click behaviour).
How should pharma brands shift their search engine marketing (SEM) campaigns?
Search Engine Machine Learning algorithms are working on behalf of advertisers by prioritizing the most engaging messaging themes thanks to functionality like:
Responsive search ads
Optimized ad rotation
Extension prioritization
In light of this, GVP of Search at Publicis Health Media, Peter Levin suggests,
“Think beyond refreshing creative through new asset submissions.”
“Brands should strive to maximize the impact of already approved assets and prioritize patient assistance and treatment accessibility messages.
Pharma brands can ensure a nimble response in the short term by enabling these features and making sure priority messages are available across campaigns while trimming away lower priority message themes. Don’t neglect planning out long-term responses with new messaging strategies and landing page content, as well as the potential for new paid keywords as the editorial landscape evolves.”
Sri Nagubandi, Director of Search at SyneosHealth suggests that,
“Pharma brands should take both a short–term and a long-term approach as this will be an ongoing concern globally until there is a viable vaccine. In the short term, brands should begin tracking ‘Brand name + Covid‘ and ‘Category Name + Covid’-related search volume to understand how patients and providers are searching around their specific brand situation. For example, we are seeing some categories like oncology where search activity is increasing as patients and caregivers seek to understand the impact on ongoing treatment, especially for the immunocompromised.”
Additionally, from an organic SEO perspective,Nagubandicautions,
“Do not use a takeover modal window on your brand.com websiteto communicate Covid-19 related messaging. Google has not suspended best practices because of the pandemic.Instead, use an updated header above the top navigation.”
How can these insights impact pharma brands’ SEM campaignsto improve patients’ lives?
With marketing budgets in flux andpaid search (SEM) being one of the few marketing channels that many marketers will continue to invest in, brands will be relying more than ever on search traffic to support their business and serve patients and providers during this challenging time. Since search advertising is a competitive, auction-based marketplace where advertisers with the most relevant and engaging ad copy typically seeimproved ad click-through rate (CTR) and reduced cost per click (CPC), ensuring your brands’ search campaigns contain frequent mentions of the above messages can help brands reach more patients and providers with potentially life-saving treatment messages within limited marketing budgets.
Ian Orekondy is the founder and CEO of AdComplyRx, a pharma ad tech stack based in New York.
There are over 3.5 billion Google searches per day. If you want to stand out, you‘ll need to play by Google‘s rules. Learn all about how you can improve your SEO, from optimizing existing pages to strategizing for local SEO and everything in between.
I’m going to make a bet with you that if you follow the 3 steps below, and you really follow them, you can get 10,000 visitors from Google.
I promise it won’t be hard, but it will take time.
And if you follow my steps and don’t get the results, hit me up and I will personally help you with your marketing.
All I ask is you do it for 3 months straight. You may not get to 10,000 visitors from Google in 3 months as some niches are really tiny, but most of you should get there or be well on your way.
Again, if you prove to me that you followed everything below and you don’t achieve the results, you can get in touch and I will personally help you with your marketing for free.
Ready?
Step #1: Finding the right keywords
If you pick the wrong keywords, you’ll find yourself with little to no traffic and, even worse, you’ll find yourself with little to no sales.
So, before we get you on your way to more search traffic,
let’s find you the right keywords.
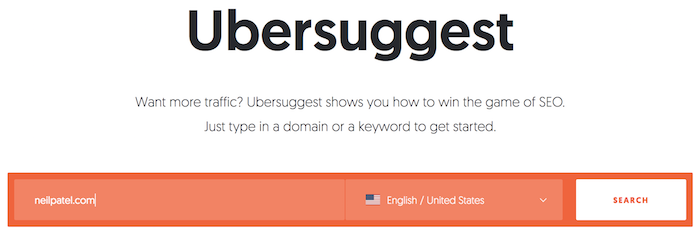
I want you to head to Ubersuggest and type in your
competitor’s domain name.
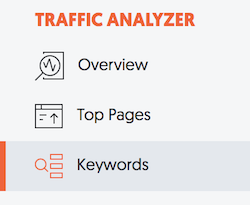
Now, I want you to click on the “Keywords” navigational
option in the sidebar.
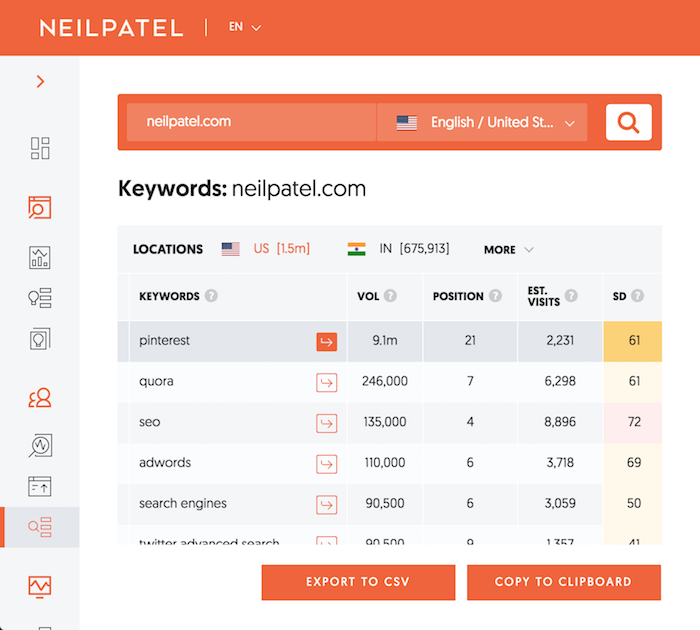
This report will show you all of the keywords that your competition is ranking for.
If you don’t see a list of thousands of keywords, that means you didn’t type in a big enough competitor. And if you don’t know who a big competitor is, just do a Google search for any major term related to your industry. The sites at the top are your major competitors.
I want you to go through the list of keywords and look for all of the keywords that are related to your business and have an SEO Difficulty (SD) score of 40 or less. The higher the number, the harder the keyword is to rank for. The lower the number, the easier it is to rank for.
In addition to an SD score of 40 or lower, I want you to look for keywords that have a volume of 500 or more.
Volume means the number of people that search for the keyword on a monthly basis. The higher the number, the more potential visitors that term will drive once you rank for it.
Next up, I want you to click on “Top Pages” in the
navigation.
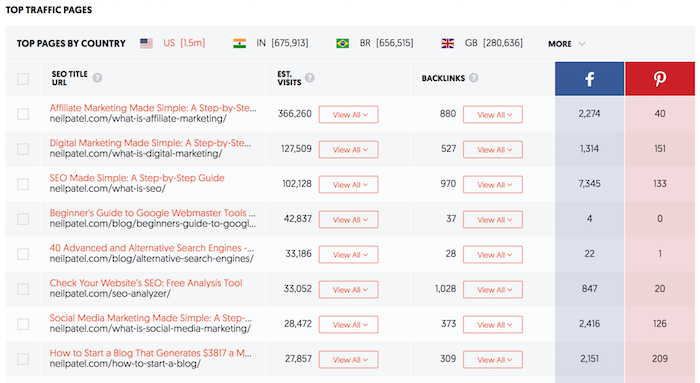
This will bring you to a report that looks like this:
This report shows you the most popular pages on your
competitor’s site.
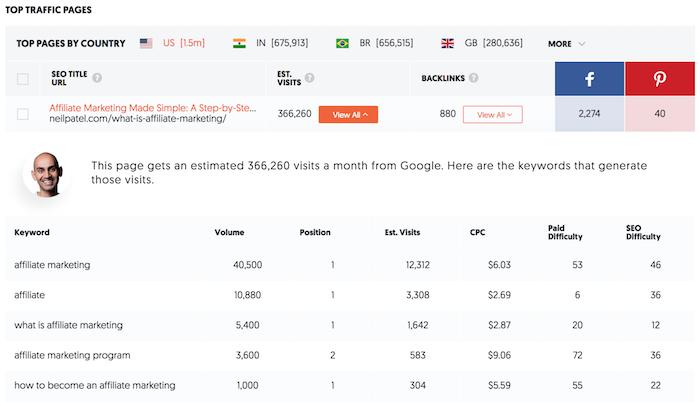
Now, under the Est. Visits (Estimated Visits) column, I want you to click on “view all” for the first few results.
Every time you do that it shows you all of the keywords that
drive traffic to that page.
Just like you did with the keywords report, I want you to look at the keywords that have an SD of 40 or lower and a volume of 500 or more.
The one difference though, is that I want you to check out some of the URLs on the Top Pages report.
Click on over to the site so you can see the type of content they are writing. This is important because it will give you an idea of the types of content that Google likes to rank.
When you create similar pages (I will teach you how to do this shortly), it will allow you to get similar results to your competition over time.
Now that you have a handful of keywords, I want you to expand the list and find other related keywords.
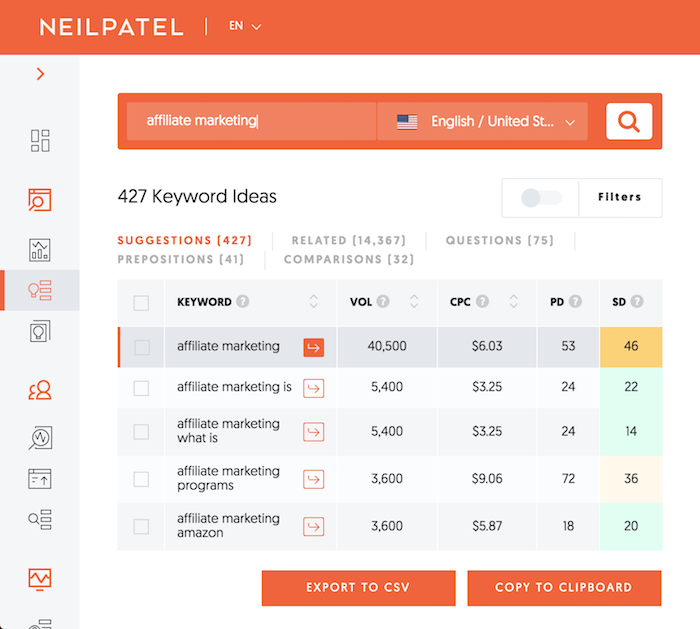
In the navigation menu, click on “Keyword Ideas.”
When you type in one of the keywords you are thinking of going after in this report, it will give you a big list of other similar keywords.
This is important because it will show you all of the
closely related terms.
For example, let’s say you came up with a list of keywords of a handful of keywords, such as:
Dog food
Cat food
Dog bed
How to clean your cat
What do birds eat
You can’t just take all of those keywords and write one article and shove all the keywords in because they aren’t similar to each other. Someone looking for “dog beds” is probably not interested in reading about what birds eat.
So by typing in a keyword into the Keyword Ideas report, it will show you all of the other similar keywords that you can include in a single article.
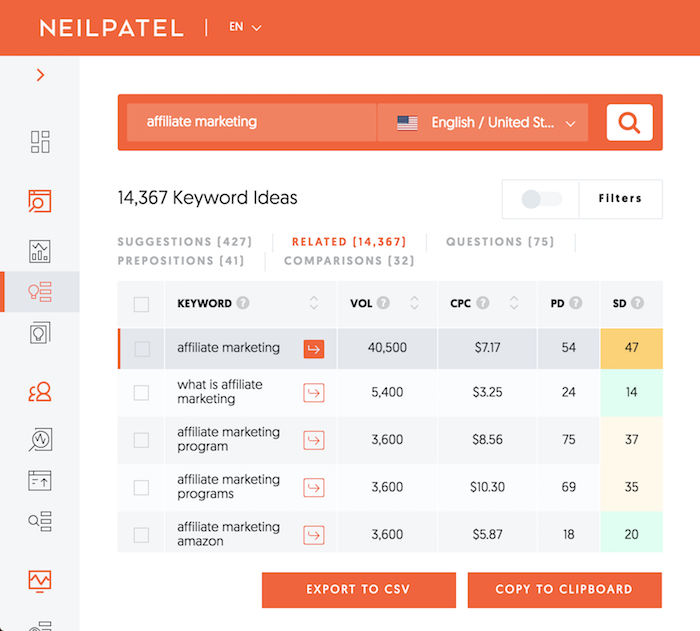
When you are on the Keyword Ideas report you’ll notice some tabs: Suggestions, Related, Questions, Prepositions, and Comparisons.
I want you to go through each of those tabs. They will show you a different group of similar keywords that you may be able to include in your article (we will go over how to write the article in step 2).
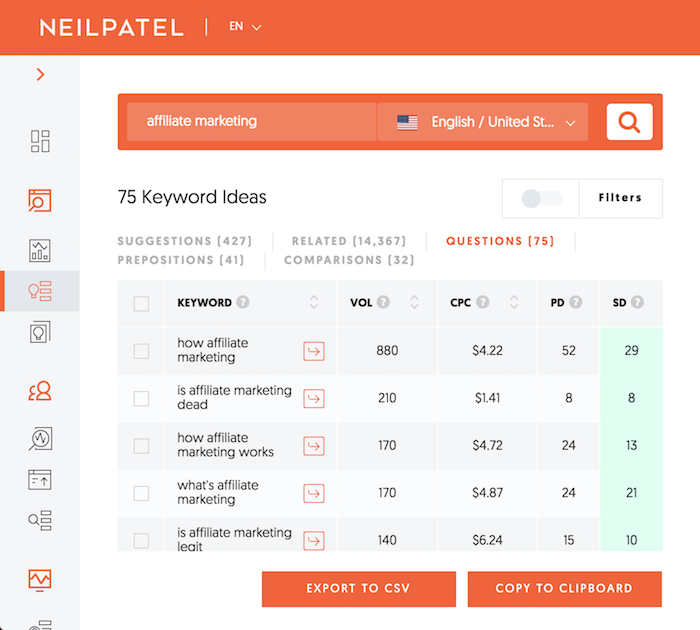
Just take a look at the Questions tab:
You can see the keywords are drastically different than the Related tab:
Again, you’ll want to look for all keywords that have an SD score of 40 or lower. But this report looks for keywords that have a volume above 200.
I know 200 may seem like a small number, but if you find 100
good keywords that all have a volume of 200 or more, that adds up to 20,000
potential visitors per month. Or better yet, 240,000 per year.
Now it’s rare that you are going to get all of those people
to come to your site, but you can get a portion of them. Even 10% would add up…
especially if you did this with a handful of articles.
Your goal should be to have a list of at least 100 keywords that are very similar. You’ll want to do this at least five times. For example, remember that list of five keywords I mentioned above wasn’t too similar to each other…
Dog food
Cat food
Dog bed
How to clean your cat
What do birds eat
You’ll want to make sure that for each main keyword you use the Keyword Ideas report to find another 100 that can accompany each keyword.
Step #2: Write content
At this point, you should have a list of keywords. If your list of keywords isn’t at least 100 keywords per group, go back to step 1 and keep at it.
It’s not that hard to get to 100 similar keywords that you can include in one article. It just takes some time to continually search and find them.
In general, as a rule of thumb, I can find 100 keywords in
less than 8 minutes. It may take you a bit longer than me at first, but once
you get the hang of it, it’ll be easy.
With your newly found keywords, I want you to write an article.
All you have to do is follow this tutorial step-by-step to write your first article.
Or, if you prefer a video tutorial, watch this:
As for your keywords, naturally place them into the article when it makes sense.
What you’ll quickly learn is that you probably won’t be able
to “naturally” include all 100 keywords within your article. And that’s fine.
The last thing you want to do is stuff in keywords because you aren’t writing this article for just search engines, you are writing it for people… and the secondary benefit is that search engines will rank it because it contains the right keywords.
Before you make your article live on your site, I want you
to keep a few things in mind:
Keep your URLs short – Google prefers shorter URLs.
Include your main keyword in your headline – by having your main keyword in your headline, you’ll be more likely to rank higher.
Include your three main keywords in your meta tags – whether it is your title tag or meta description, include at least three main keywords in them. You won’t fit as many in your title tag, and that’s fine, but you should be able to within your meta description tag.
There are a lot of other things you can do to optimize your articles for SEO, but my goal is to keep this simple. Again, if you just follow these three steps, you’ll hit the 10,000-visitor mark.
So, for now, let’s just keep things simple and once you hit
your goal, then you can get into the advanced stuff.
Step #3: Promoting your content
Writing content is only half the battle. Even if you include the right keywords in your article, if you don’t promote, it’s unlikely that it would be read or rank on Google.
So how do you make sure your content is read and ranks well?
Well, first you need to get social shares, and second, you need to get backlinks.
Yes, search engines don’t necessarily rank pages higher when
they get more Facebook shares or tweets, but the more eyeballs that see your
page the more likely you are to get backlinks.
And the more backlinks you get, generally, the higher you will rank.
So here’s how you get social shares…
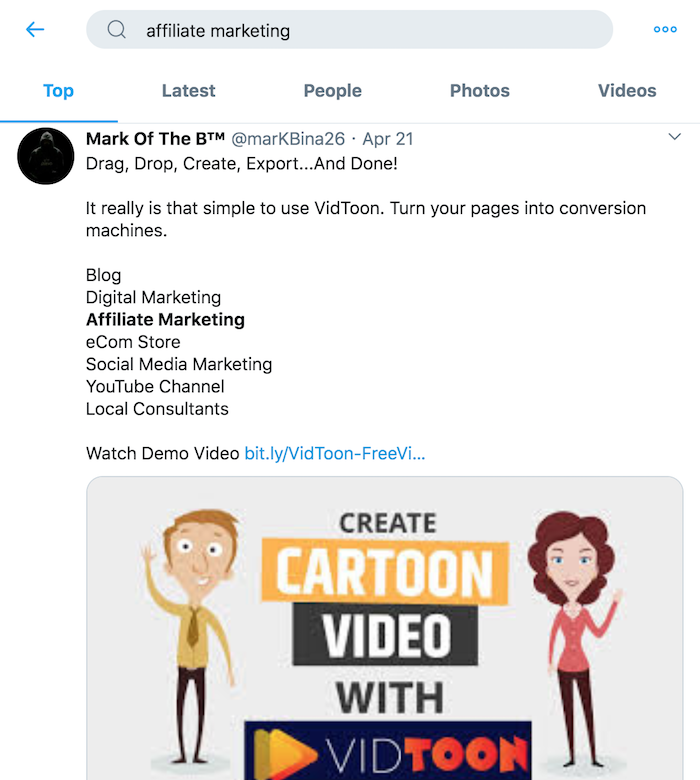
First, I want you to go to Twitter and search for keywords related
to your article.
As you scroll down, you’ll see thousands of people tweeting about stuff related to your keywords. Some of them will just be general updates but look for the members sharing articles.
And…
Now what I want you to do is click on their profile and see if they mention their contact information or their website. If they mention their email you are good to go. If they mention their website, head to it, and try to find their contact information.
You won’t be able to find everyone’s contact information,
but for the people you do, I want you to send them this email:
Subject: [insert the keyword you searched for on Twitter]
Hey [insert their first name],
I saw that you tweeted out [insert the title of the article they tweeted]. I actually have an article that I recently released on that subject.
But mine covers [talk about what your article covers and how it is unique].
[insert link to your article]
If you like it, feel free to share it.
Cheers,
[insert your name]
PS: Let me know if you want me to share anything for you on Twitter or any other social network.
What you’ll find is a large percentage of the people will be willing to share your content because they already are sharing related content and, of course, you offered to share their content, which helps out too.
If you send out 30 to 40 emails like this, you’ll start
getting traction on the social web.
Now that you have social shares, it’s time to build backlinks. Instead of giving you tons of link building methods as there are many that work, I am just going to start you off with one that works very well.
I want you to head back to the Keyword Ideas report on
Ubersuggest.
Once you get there, type in some of the keywords that you are trying to go after.
On the right side of the report, you’ll see a list of sites that rank and the number of backlinks that each of the ranking URLs has.
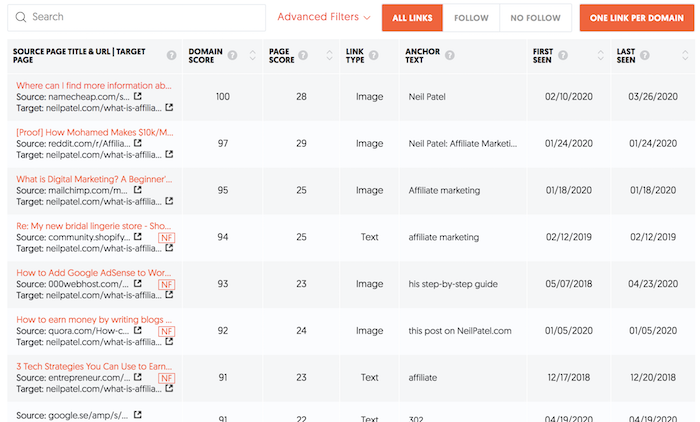
Click on the “Links” number. For each result, it will take you to the Backlinks report, which looks something like this:
This will give you a list of all the sites linking to your
competitor’s article.
I want you to go to each of those URLs, find the site owner’s contact information, and shoot them an email that looks like this:
Subject: [name of their website]
Hey [insert their name],
I noticed something off with your website.
You linked to [insert your competitor that they linked to] on this page [insert the page on their site that they are linking to them from].
Now you may not see anything wrong with that, but the article you linked to isn’t helping out your website readers that much because it doesn’t cover:
[insert a few bullet points on how your article is better and different]
You should check out [insert your article] because it will provide a better experience for your readers.
If you enjoyed it, feel free to link to it.
Cheers,
[insert your name]
PS: If I can ever do anything to help you out, please let me know.
I want you to send out 100 of those emails for each article
you write.
Conclusion
Yes, it takes work to get 10,000 visitors but once you do it you’ll continually generate traffic and, more importantly, sales.
To achieve 10,000 visitors, I want you to do the steps above five times. In other words, you will be writing five pieces of new content following the steps above.
It’s actually not that bad because you can just do 1 a week.
So, within 5 weeks you would have done your job.
So, are you going to accept the challenge? If you do everything and don’t see the results over time, you can hit me up and I’ll help.
Less than two months ago, I interviewed several agency leads about how their organizations were helping CMOs break down the barriers to digital transformation. In what can now be best described as a prescient moment, Razorfish President Josh Campo told me that digital transformation is kind of like having to build the plane while you’re flying.
At the time, he said most brands come to his agency because of a specific challenge — and that, after looking at the problem, his agency would often see an opportunity to really drive transformation. But now, as the COVID-19 crisis continues to dramatically shift consumer behavior, businesses across industries are neck-deep in an economy where digital transformation is imperative to surviving outcomes caused by the pandemic.
Digital transformation doesn’t have to take years
The good news is digital transformation does not have to take years to implement or need an IT organization to launch. Lytics President Jascha Kaykas-Wolff addressed a number of misconceptions during his Discover MarTech presentation “Digital Survival. Right Now.” One of the most popular misconceptions attached to digital transformation, according to Kaykas-Wolff, was the idea that it must be led by IT, involve a comprehensive data initiative mapping a 360-degree view of the customer and come with long, complicated RFPs.
“You do not need to connect together all of your customer data,” said Kaykas-Wolff. In fact, his company’s data shows organization often want to map over 100 digital fields to build a full-view of the customer, but less than 10% of customized fields are actually used to segment customers and activate the data for campaigns. He also says 82% of predictive data used for recommendations comes from behavioral data already, “at your finger tips.”
In other words, digital transformation doesn’t have to be a multi-year, or even multi-month, initiative.
Why your team plays a pivotal role in your digital transformation
Widen Director of Customer Success Michael Shattuck echoed Kaykas-Wolff’s take on digital transformation, noting how projects that used to be a year-long process are now being rolled out in two to three weeks time.
Shattuck goes as far as defining digital transformation as “Changing the potential of human beings in the organization.” He notes how crises are often what pushes people to their highest potential, and that the pandemic has put a spotlight on all the ways companies may have under-utilized the talents of individual members within their team.
Digital transformation is not about digitizing a business, but unlocking human potential, said Shattuck, “Ultimately, it’s about people.”
He also emphasized the importance of paying attention to your employees’ needs, especially now when physical interactions between staff has been cut-off. If business leaders fail to take the time to support their employees — reaching out to check-in on them and make sure they’re doing okay — companies risk creating a revolving door of talent. It’s not an HR issue, according to Shattuck, it’s an organizational issue.
The biggest obstacle to digital transformation
Shattuck says breakdowns in communication are the biggest deterrent to digital transformation. To limit communication missteps, he recommends forming a “digital transformation coalition” made up of team members from different levels within the business. The coalition’s top priority should be identifying barriers across the company’s culture, technology and process.
Once the coalition has identified challenges, the next step is to take inventory: What is the business equipped to deal with? What is it unprepared for? What customer issues have become obvious?
He says businesses can’t rely solely on expensive technology solutions to implement digital transformation measures, or simply copy other companies that have made it work. What may be needed for transformation at one company may not fit another company’s needs. By identifying your company’s own challenges, you can then design a crisis strategy that fits your organization’s business model.
Keeping your customer at the center of your digital transformation intiative
“All digital transformation begins and ends with the customer,” said Geekhive CEO Peter Ladka. He discussed the need for businesses to be “future ready” as they move beyond their digital transformation initiatives during his Discover MarTech presentation.
According to Ladka, true digital transformation is evolutionary and continually changing — and to keep things rolling along, businesses must constantly be asking how each project serves the customer.
Ladka shared the following suggestions for companies to keep their business primed as we move into this new world created by the coronavirus crisis: Establish quarterly content, customer experience, data and UX goals. And then, identify KPIs to move the goals forward, along with ways to measure those KPIs — checking in on the goals every 90 days.
“If you can’t measure it, you can’t manage it,” said Ladka.
About The Author
Amy Gesenhues is a senior editor for Third Door Media, covering the latest news and updates for Marketing Land, Search Engine Land and MarTech Today. From 2009 to 2012, she was an award-winning syndicated columnist for a number of daily newspapers from New York to Texas. With more than ten years of marketing management experience, she has contributed to a variety of traditional and online publications, including MarketingProfs, SoftwareCEO, and Sales and Marketing Management Magazine. Read more of Amy’s articles.
Changing circumstances can force you to confront the future. Planning ahead is essential and can better prepare you for what comes next. While a model won’t perfectly predict what comes next, it can be vital in preparing and setting realistic expectations.
In this article, we’ll cover a few approaches that you can explore and build on. It’s worth noting that while there is no out-of-the-box solution, the process and business knowledge you can apply are what make these tools valuable.
Simple Math
With a few formulas, you can quickly pace account metrics, understand the direction of your account, and plan for the rest of the month. Sometimes the simple method is all you need.
One common method involves taking the current total, taking the average of the last seven days, and multiplying it by the remaining days in the period.
For a month this looks something like a month to date spend + last seven day spend/7 * days remaining in the month.
Simple forecast example in Google Sheets
The simplicity of this method makes it intuitive and easy to adjust for. Seven days is a great starter as most accounts follows a typical cycle as activity rises and falls through a weekly period. You can adjust it for stability by increasing the seven days to 14 or 21. The beauty is that the formula starts so simply that it’s not a big investment to make changes.
If you need to add more nuance you can apply this same method to account segments to account for differences in brand investment, non-brand, shopping, or the product line level. You can also add further modifiers to weight the remaining days differently. The best part of this method is that it can be easily modified, is intuitive, and produces reasonable results with little effort.
Data tables are a great method to estimate the account level effects of changing metrics. You can take an efficiently metric such as ROAS or CPA and create a table with new CPAs/ROAS by different cost per clicks and click through rates. This helps you forecast the impact of performance changes in your account.
Excel Data Table Example
Unlike the previous example, it does not account for time. Instead, it provides useful benchmarks for upper and lower limits in performance. It clarifies possibilities and outlines the bounds of performance. You can use it these as a best-case and a worst-case scenario or see how far metrics would have to change to hit a goal target.
Or course models can go much further. You can explore time series with Holt-Winters, ARIMA, and more. While these are not always directly applicable to daily work and optimizations they can be useful when longer terms forecasts are needed. The main benefit is that they are built to account for trends and seasonality. Something our naïve models don’t account for.
Holt-Winters Output for Web Traffic
The downside here is that these models often require more knowledge on the topic or a tool to pull them off. Notably programming skills and packages like tidymodels in R or statsmodels in Python. If you need further motivation, check out the other benefits of learning Python – How Learning Python can Improve your PPC Campaigns.
Holt-Winters can be quickly applied in Excel though. Here is a fun blog article that walks through a hypothetical example. It’s not directly PPC related but the method is easily adaptable. This method will account for multiple factors such as seasonality and overall trends in predicting future performance. It’s a great tool for spotting anomalies or adding to a quarterly review.
We covered a few approaches in this article. Each one requires a bit of nuance and modification to be directly useful. They are not exclusive though. I encourage you to try multiple methods and models to dive deeper into account performance. Once you get started you might find it to be one of your favorite tasks!
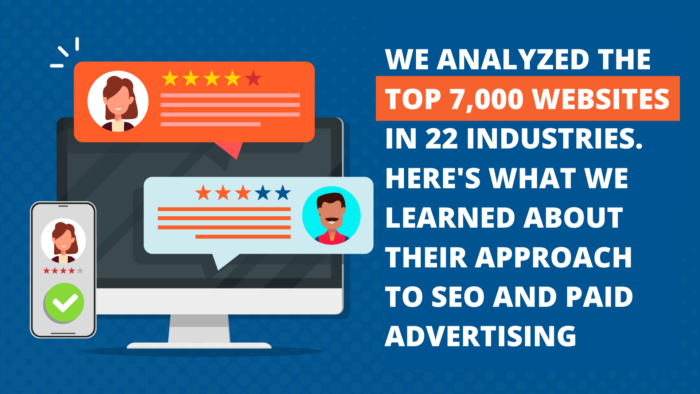
We analyzed more than 7,000 company websites across 22 industries to answer one question: what was their approach to SEO and paid advertising to help them do so well?
In this analysis, we only looked at companies that ranked well and had at least a 4-star review or higher. These businesses aren’t just liked by Google, they’re also liked by customers.
Through Ubersuggest, we learned more about their approach to SEO, traffic factors, backlinks, and more which you will see in the visualizations below.
What Industries Did We Look At?
The 22 industries analyzed in this report were:
Education and Training
Public & Local Services
Home Services
Animal & Pets
Vehicles & Transportation
Media & Publishing
Sports
Hobbies & Crafts
Events & Entertainment
Restaurants & Bars
Travel & Vacation
Shopping & Fashion
Electronics & Technology
Food, Beverages & Tobacco
Home & Garden
Business Services
Money & Insurance
Legal Services & Government
Health & Medical
Construction and Manufacturing
Beauty & Well-being
Utilities
Key Findings
There is no one-size-fits-all approach to digital marketing. Black and white advice doesn’t work for every company.
You will need to take a different approach depending on the audience in your industry. That is why we included a wide range of industries in our analysis instead of just making blanket statements.
Here are a few key insights we found:
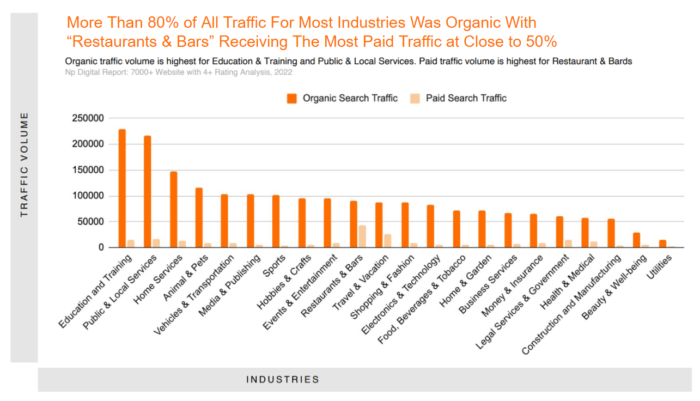
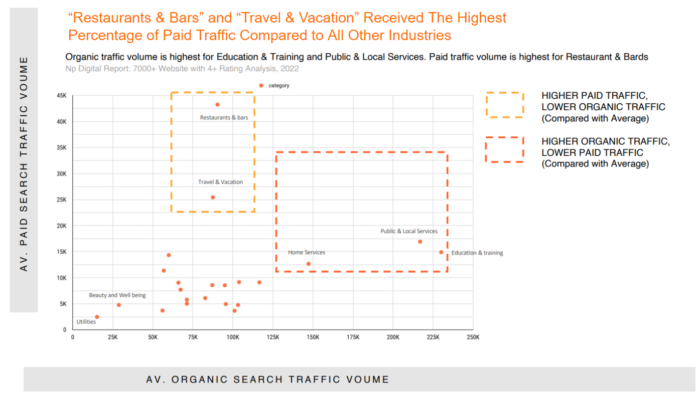
Companies in all industries get more organic traffic than paid traffic. However, Restaurants & Bars and Travel & Vacation received more paid traffic compared to other industries.
The average website authority score was between 30 and 40 for the companies in each industry analyzed. Some industries, such as Utilities and Animals & Pets,were lower than average.
Public & Local Services face the highest average keyword difficulty for target terms. Beauty & Well-Being faced the lowest average difficulty for target keywords.
More than 75% of total backlinks across all industries were text backlinks.
Companies in all industries targeted more informational intent keywords, however traffic volume was driven by a mix of different intent keywords.
Does most of your traffic come from paid ads or organic search? We looked at the difference in volume between organic search traffic (traffic driven from search engines like Google) and paid traffic (traffic driven to your site via paid ads.)
These trends highlight where industry leaders are focusing their marketing efforts—and whether those results are paying off. We found several interesting trends in this data.
NOTE: the numbers below represent the average organic and paid traffic per company website, not a total of all traffic in that industry.
Public & Local Services received 216,861 visits from organic search and only 16,931 from paid search, less than 10 percent of total traffic. Public services, like a power company, are unlikely to use paid ads since people will generally just choose one of the few services offered in their area.
Focusing on SEO can benefit these companies more. That said, the low competition for paid ads could represent an opportunity to boost their presence.
Companies focused on Education and Training received the most organic searches at 230,075 visits per month. These companies should focus more on SEO and content marketing but also keep an eye on how to leverage paid ads since competition is low.
Restaurant & Bars sites, on the other hand, rely more heavily on paid traffic compared to all industries with almost 50% coming from paid ads.
People searching in this category are probably looking for somewhere to go soon so using paid ads to increase conversions makes sense.
Travel & Vacation sites also rely on paid ads that results in close to 30 percent of their traffic. Organic traffic is still higher but it looks like companies also boost their offerings through paid ads.
If you are new to the sector, focus on increasing organic traffic right away as it will take longer to see results. Paid ads are effective as well, but they can be expensive.
Shopping & Fashion only got a bit less than 10 percent of traffic from paid ads. This could mean companies focus more on social sharing and social media ads since a lot of content is visual.
The Sports industry received the least traffic from paid ads at under 4 percent. This was interesting since the industry includes a lot of ecommerce brands that sell sports gear, outdoor apparel, sports drinks, and team apparel.
This could indicate a trend towards more social sharing and social media ads as well. It could also mean impulse purchases are less common since customers are more likely do their research. Therefore, creating educational content might be the way to go.
Analysis #2 – Trends Related To Authority Score, Keyword Difficulty, and Average CPC
How does domain authority vary across industries? Does it correlate with how much you’ll pay for ads? Does keyword difficulty have an effect? We dug into this data to see trends for each industry.
Authority Score measures your website’s Domain Authority which also influences rankings. It grades the overall website quality based on the number of backlinks, referring domains, outbound links, etc.
Authority Score is also relative to your industry.
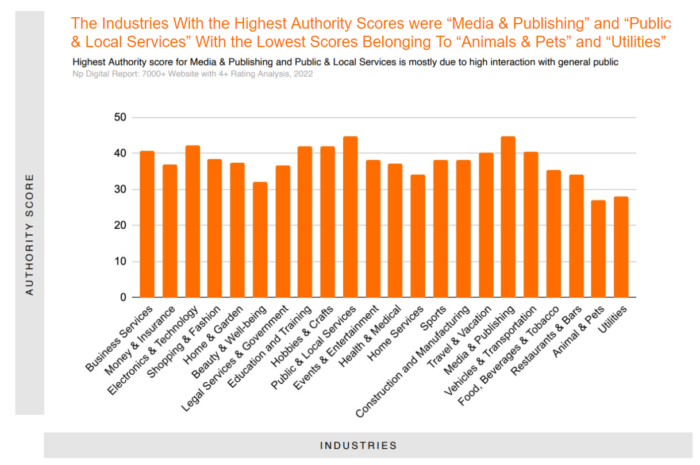
Average Authority Scores Across All Industries
This first chart shows the average website authority score for businesses in each industry.
Hundreds of business sites were looked at in each industry with a mix of higher and lower authority scores, resulting in the numbers above.
Media & Publishing had the highest average authority score of 44.62 followed very closely by Public & Local Services at 44.61. Business sites in each sector are usually more trusted sources so this makes sense.
On the flip side, the lowest authority score industries were Utilities at 28.09 and Animals & Pets at 27.08. A lot of factors could have led to this such as many new sites created in each industry.
There was close to a 20 point variation in authority scores across all industries in this analysis with the median score being 38.06.
Websites between 40-50 are considered average
Websites between 50-60 are considered good
Websites above 60 are considered excellent
What does this mean for business websites and marketers?
This analysis looked at companies with high review ratings which means they placed a lot of emphasis on reputation management, maybe more so than SEO factors.
We can see that a business’s authority score didn’t really impact whether or not they got a high review rating. People-focused more on reviewing products and services than the business itself.
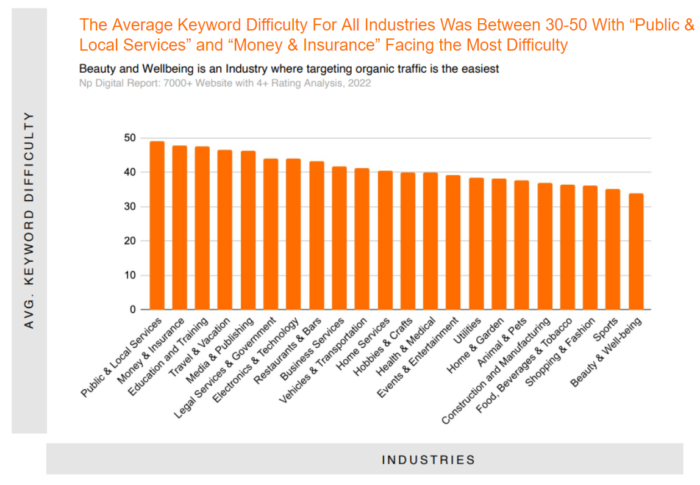
Average SEO Keyword Difficulty Across All Industries
Next, we looked at the average keyword difficulty for terms in each industry. Most content creators target keywords with low difficulty and high volume which is easier for some industries than others.
Industries with the highest difficulty were Public & Local Services at 49.02, Money & Insurance at 47.72, and Education and Training at 47.62.
To improve their search rankings, these industries will likely need to spend more time on their SEO strategy or invest more heavily in paid ads.
Industries with the lowest difficulty were Shopping & Fashion at 36.26, Sports at 35.12, and Beauty & Well-being at 33.75. It will be easier for these industries to find keywords to rank for.
Across all industries, the average keyword difficulty for SEO is 41.
What does this mean in practice? Relativity matters when looking for low-difficulty keywords.
For example, say you’re a business in the Money & Insurance industry and find two terms you’re not ranking for. One has a keyword difficulty of 45 with a search volume of 12,000, the other has a keyword difficulty of 40 with a search volume of just 6,000.
Understanding that 45 is below the average difficulty in your industry, targeting the higher volume term might not be a bad idea. You could also target related keywords as well and use paid ads to boost some of the more difficult ones to expand your reach.
For industries with low average keyword difficulty like Beauty & Well-being, target easy-to-rank-for terms to increase traffic, then use CRO strategies to leverage that traffic.
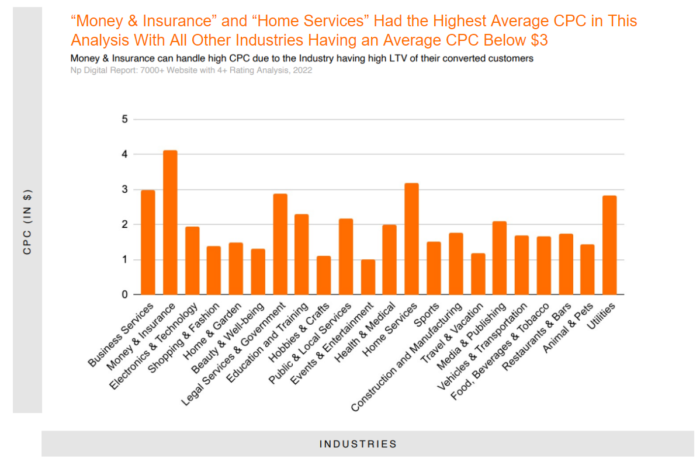
Average CPC (Cost-Per-Click) Across All Industries
The final graph of this section looks at the average CPC for each industry. We were curious to see if any correlation existed with the average authority score of company websites. Here’s what we found:
Very little correlation between the industry’s average authority score and their average CPC was found.
For example, a site selling $20 t-shirts won’t spend $10 per customer but an investment site whose average purchase price is more than $100 might.
In this analysis, Money & Insurance has the highest average CPC at $4.12.
Businesses in this industry might be willing to spend more on average for each click since the lifetime value (LTV) of each customer is much higher.
Hobbies & Crafts has the lowest average CPC of $1.12 across all industries.
They only receive about 5 percent of traffic from paid ads which could indicate that businesses focus more on social channels where many craft/hobbyist groups and influencers exist.
Home Services has a higher average CPC at $3.17. Business sites in this industry include plumbers, lawn care work, etc. Increased competition for local customers has likely led to the higher average CPC.
Shopping & Fashion had one of the lowest average CPC’s at $1.40.
This could be another indication that businesses promote their visual content more on social media. However, the low average CPC could represent an opportunity to get creative with paid ads.
Analysis #3 – Average Number of Backlinks Per Industry and Their Most Popular Formats
Backlinks matter—that’s nothing new. What about the format of those backlinks? Is a text backlink better than an image backlink? How many backlinks is enough?
That’s what we aimed to find out.
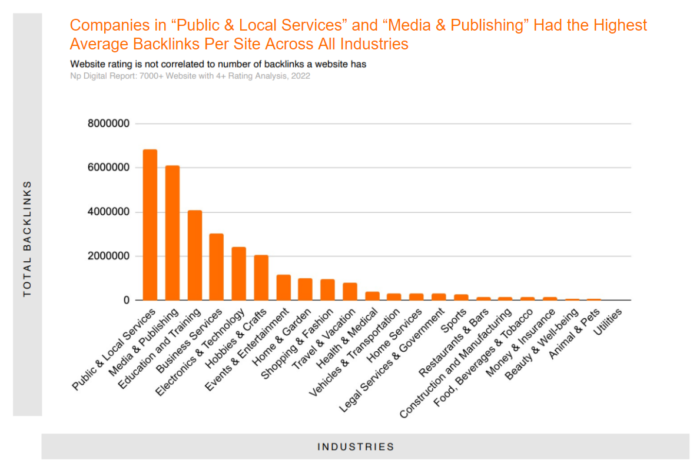
Average Number of Backlinks Per Industry
The average number of backlinks varies quite a bit by industry with the most belonging to:
Public & Local Services at just over 6.5 million per site
Media & Publishing at just over 6 million per site
Education and Training at just over 4 million per site
These industries include more trustworthy business sites such as essential local services, news outlets, media publications, universities, certification platforms, and more.
The lowest average backlinks belonged to Beauty & Well-being, Animals & Pets, and Utilities. This could indicate each sector focuses more on social media or they have a lot of new business sites.
Money & Insurance coming in very low was surprising to me. I would have expected the industry to average at least as many backlinks as Shopping & Fashion at just under 1 million per site.
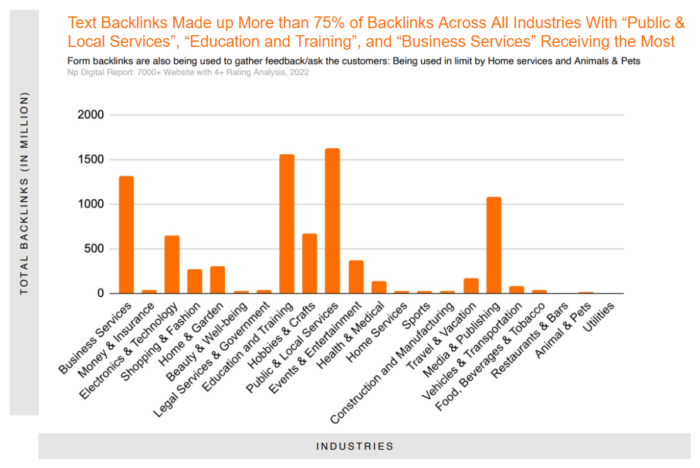
Distribution of Backlinks by Format
We also looked at the distribution of backlink types across each industry to see which performed best. The two backlink types that stood out were:
text backlinks
image backlinks
NOTE: the graphs below represent the total number of backlinks for each industry, not the average for each company website.
Text backlinks were the most popular across all industries:
Public & Local Services received the most at just over 1.6 billion
Education and Training was next at just over 1.5 billion
Business Services followed at just over 1.3 billion
Media & Publishing was the last with just over 1 billion
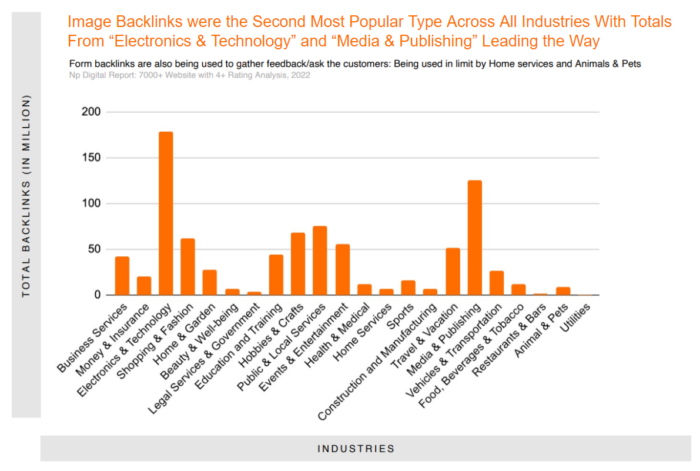
Image backlinks were the second most popular type. The two industries that used them the most were:
Electronics & Technology at close to 180 million
Media & Publishing at just over 100 million
The two other types of backlinks used were form and frame backlinks. However, both combined made up less than 5 percent of total backlinks across all business sites in this analysis.
What does this mean?
Text backlinks are the most popular for driving traffic across all industries but some industries will also rely just as much on image backlinks.
You should mix up your approach, leveraging different backlink types to reach different audiences.
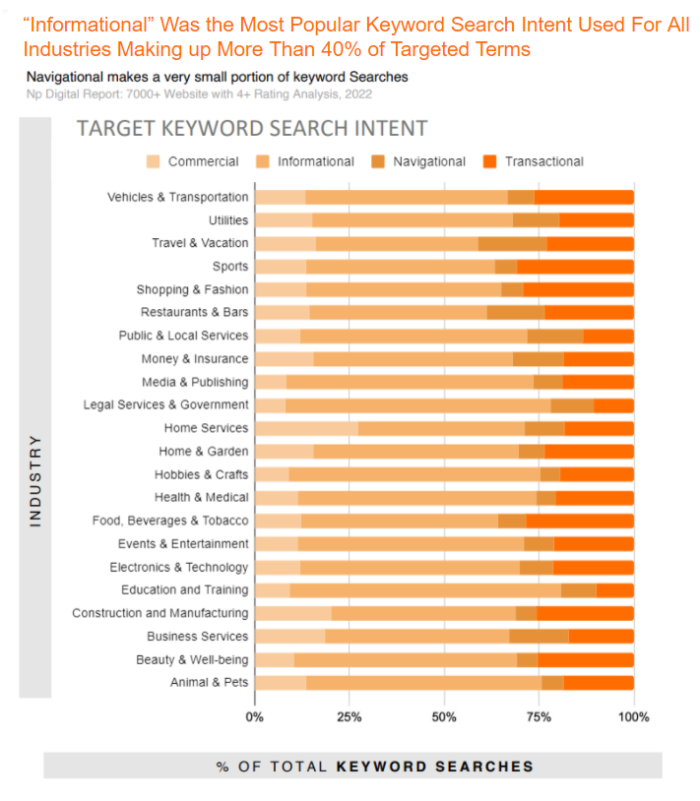
Analysis #4 – Target Keyword Intent and the Intent That Led to the Most Traffic
Lastly, we looked at target keyword SEO intent in each industry based on the following categories:
Commercial intent keywords: related to specific brands or services (“find a Starbucks near me”)
Informational intent keywords: searching for answers to questions (“How to unclog a tub”)
Navigational intent keywords: users looking for specific pages (“Comcast login page”)
Transactional intent keywords: users are ready to buy (“buy converse shoes”)
Looking at different keyword intents when choosing target terms can highlight trends and opportunities in your industry.
So, what did we learn?
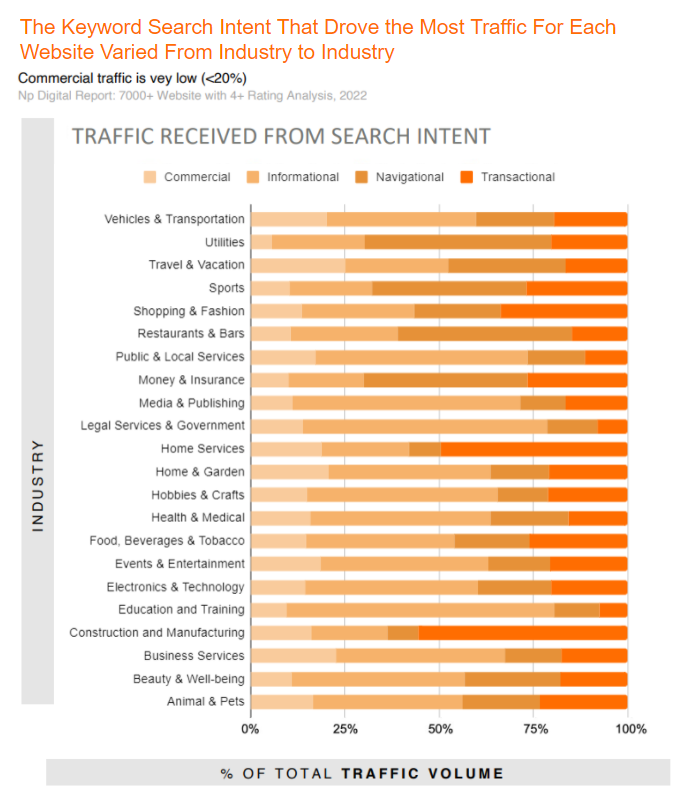
NOTE: The first chart indicates the keyword intent of target terms in each industry. The bottom chart shows which intent type resulted in traffic to each business site.
The most popular keyword intent was informational at more than 40 percent of target terms in all industries.
These are generally top-of-the-funnel keywords, meaning users are still early on in their journey.
The next highest intent type was transactional at between 15-20 percent of terms per industry.
These users are ready to buy so creating content that targets these terms or using paid ads is a good idea.
Next, we looked at which intent keywords drove the most traffic to company sites in each industry.
Like most industries, Utilities sites mostly target informational keywords. However, most of their traffic comes from navigational terms which relate more to specific pages and their brand name.
This is likely due to search behavior, rather than incorrect targeting practices.
For example, if someone wanted to pay a power bill, they might type “pay bill X” in Google to find the right page. You wouldn’t target this term directly but it does bring traffic to your site. Focusing on informational keywords that establish trust is still the right approach.
Similarly, Money & Insurance websites focus on informational terms but get most of their traffic from navigational terms.
This could be a combination of good branding as well as similar user search behavior patterns. Usually, for your navigational terms to be successful, users will have read your informational content before deciding you were the right fit for them.
On a different note, Construction & Manufacturing businesses target informational keywords but also target transactional keywords at a higher rate than other industries. Clearly, this strategy works as most of their traffic comes from transactional terms.
Lastly, Home Services target more commercial intent keywords than other industries. These are likely terms more focused on a particular location using phrases such as “near me” or “in [city]”.
However, we can see that just under 50 percent of their traffic comes from transactional terms. This means they might want to adjust their focus to include those terms along with their commercial approach.
Keep in mind that just because your website receives traffic doesn’t mean it is all converting. Make sure your traffic is directed right pages on your site and each page is optimized for conversions.
Conclusion: Summary of Findings
There were a few surprises in this data—and a few things that turned out exactly as we expected.
For example, backlinks matter. Google has been telling us that for years, so I wasn’t surprised to see the highest-reviewed business websites tend to have a pretty high volume of links.
What was surprising was the variation in the types of backlinks between different industries. This data can be incredibly valuable for sites looking to build a more effective backlink profile.
I was also interested in the differences between the types of keyword intent most sites target for SEO (primarily informational) versus where they are getting their traffic from. Depending on your industry, this data could highlight incredible marketing opportunities or gaps in your current strategy.
Which finding was most interesting or useful to you?