Many of us have seen how powerful infographics can be in marketing campaigns. And at the same time, we have all seen more infographic fails than successes. For this reason, our team chose to get insights from guest Visme App and our community via #SEMrushchat.
As always, there were many diverse opinions, tips, and experiences — all of which are useful for marketers and businesses. Here is everything this guide will cover:
Infographic Planning: Questions to Answer
You only get bet benefits out of an infographic when it has been carefully planned with goals and returns in mind. Here are some questions you should answer before attempting any infographic marketing.
- Who is this infographic being created for?
- What does the reader need to know?
- How will the infographic help them?
- Who will do the research and provide the data that goes into the infographic?
- Who determines if this info will matter to the reader?
- How will it be promoted? Which platforms? And where is the audience you are targeting?
- How will it benefit the business? What is the ROI? Links, brand awareness, new clients?
- Who is going to design the infographic? (Quality matters)
- What type of infographic will work best?
- How will the infographic be repurposed for social platforms and marketing strategies?
- Where will the infographic be hosted? A blog post? A news page? (You need a link back to it on your site)
If you want to avoid wasted time and resources used for creating an infographic, you need to have a plan and strategy in place before you start. Here is an infographic Visme provided with even more helpful questions:


Top Benefits of Using Infographics In Digital Marketing
Choosing a marketing strategy can be hard. No one wants to attempt a strategy and not succeed, so they often shy away from techniques they are unsure of. When it comes to infographics, there are a lot of benefits you should be aware of.
- They are great for the visual learner.
- Data in infographics can be easier to consume than text on a page.
- The imagery and visual cues can make data and information easier to remember.
- They are a chance to share your authority to people in mass.
- When done right, they can be broken into smaller infographics for marketing and content.
- A good infographic can build a lot of backlinks.
- They can result in a lot of social shares.
- They can be great for multiple age demographics and different populations.
- Quality infographics with valuable information are good for improving brand awareness.
Additional Infographic Benefits
“The big benefit is that a great infographic can convey so much information at a glance. It can tell a great story using data. And the visual nature catches people’s attention quickly.” — Gene Petrov
“Infographics visualize data and information, making it more snackable and easy to understand. This increases engagement with your content, gives great viral potential, and helps you to connect with your audience.” — Visme
“Visual answers attract the eye quicker than any text. This is a subconscious deep instinct humans cannot avoid, so is powerful for attracting attention.” — Simon Cox
“I think scannability is one of the major advantages of infographics — but this needs to be done right. There are few things worse than an overload of text shoehorned into a graphic. Make sure designers are involved from the outset.” — David Simanoff
“If done right it is the perfect blend between text and visuals, making it easier for the mind to consume! Not to mention, it is easily eye-catching, easily remembered, and portable.” — Synthesio
“From a B2B perspective, infographics could be things like cheat sheets which are incredibly useful & shareable in the industry for simplifying complex topics.” — JP Sherman
“As a visual learner, I really love when brands have infographics in articles and other marketing materials. It really helps me to process the information.” — Mara
Here is an example of an infographic that educates and meets all the criteria mentioned above.
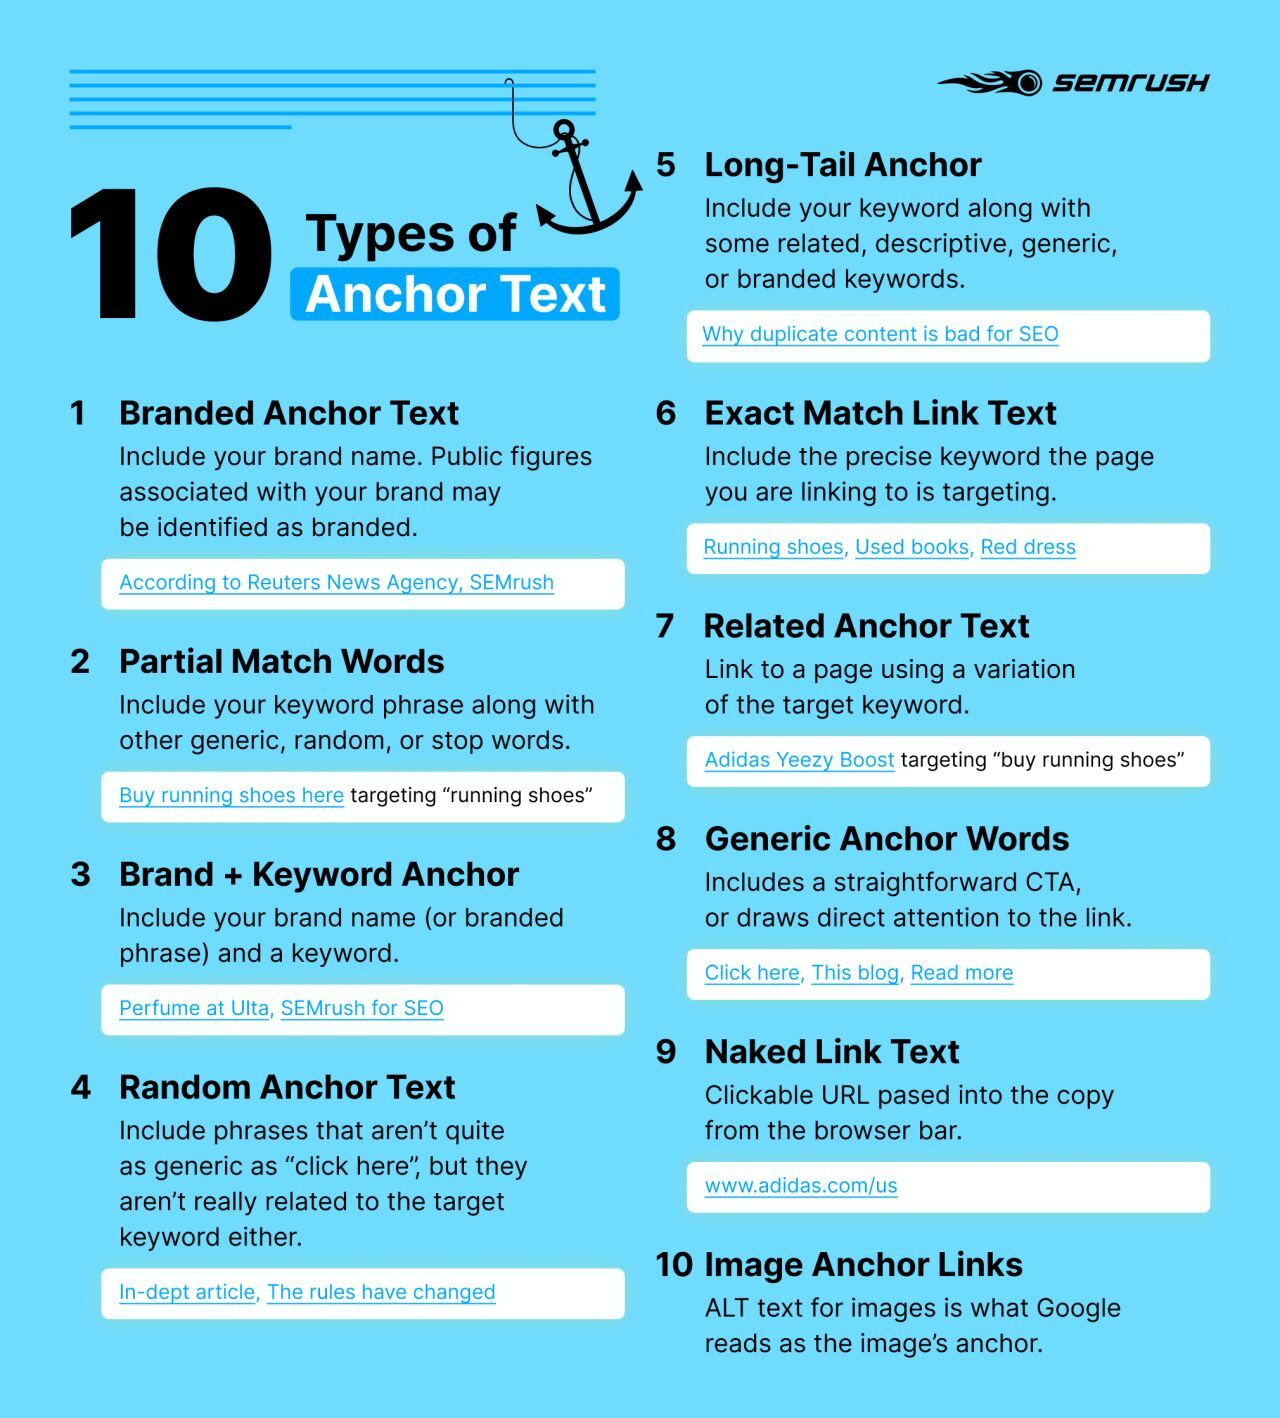

Essential Elements Needed to Create Quality Infographics
As with everything, quality matters; you can have great data and helpful info that people need, but if you don’t present it the right way, the infographic is useless.
People don’t work hard to find the information they need; they want everything to be easy to read and easy to find — this is critical for websites and infographics. Make sure your text is easy to read — font, font size, and amount of text impact readability.
Let’s see tips from our participants:
“A good infographic should include a well-balanced union between text and visuals, enough white space between margins and elements, only 2-3 fonts and colors throughout, a single main point, and good visual flow. Here are our best practices: https://visme.co/blog/infographic-best-practices/.”— Visme
“Actually using graphics to convey data properly. It’s ridiculous the number of infographics that border on completely arbitrary graphics. Plenty of other good suggestions already, but this is one of my big pet peeves.” — Michael Ramsey
“The quality of the graphic. This sounds self-explanatory but I often see infographics that look visually horrible. This will deter audiences from actually reading the content. Even if your data/knowledge is incredible, don’t put users off with poor graphics!” — Itamar Blauer
“It goes beyond layout and verbiage. I think good infographics are those that meet the needs and expectations of the audience. The elements for an infographic for a B2C customer on Instagram are *very* different than the ones for a B2B customer on a blog.” — David Simanoff
“It needs to flow. You need to be able to lead the reader through the infographic so they absorb all the information.” — Stevie Howard
“Infographics need to be quick and to the point. Include the important facts or important elements that the audience want and keep the major details to a minimum (reference the article). It also needs to be visually appealing and easy to read and understand.” — Bernie Fussenegger
Informational Infographic Example:
The infographic below incorporated every recommendation you see above. It was created for our Voice Search Study. Notice the different sections and how important stats are highlighted. Text is easy to read and data is easy to find, and as Bernie says above, major details were kept to a minimum.


Creating a Successful Workflow for Creating Infographics
I asked Avalaunch, a well-known agency that specializes in infographic creation, what their workflow was, and they were kind enough to share. Here is what they said:
“We start at various points in the infographic process with different clients, depending on their internal resources/needs.
1. Content strategy – come up with a topic based on your goals (trying to get media attention, informational for current customers, drive traffic to your website, etc.)
2. Copy – a typical infographic for the web is 400-500 words. Typically having stats/numbers is helpful to visualize a concept.
3. Design – establishing branding, colors, fonts, iconography style
4. Outreach/Promotion – once you create your infographic, you need to get it in front of people! A good way to do this is to create social thumbnails (based on the IG design) to post on your social channels and then tell them to click on the link to see the full graphic on your site. Also, reaching out to relevant bloggers, media channels, and influencers to share your graphic is helpful.
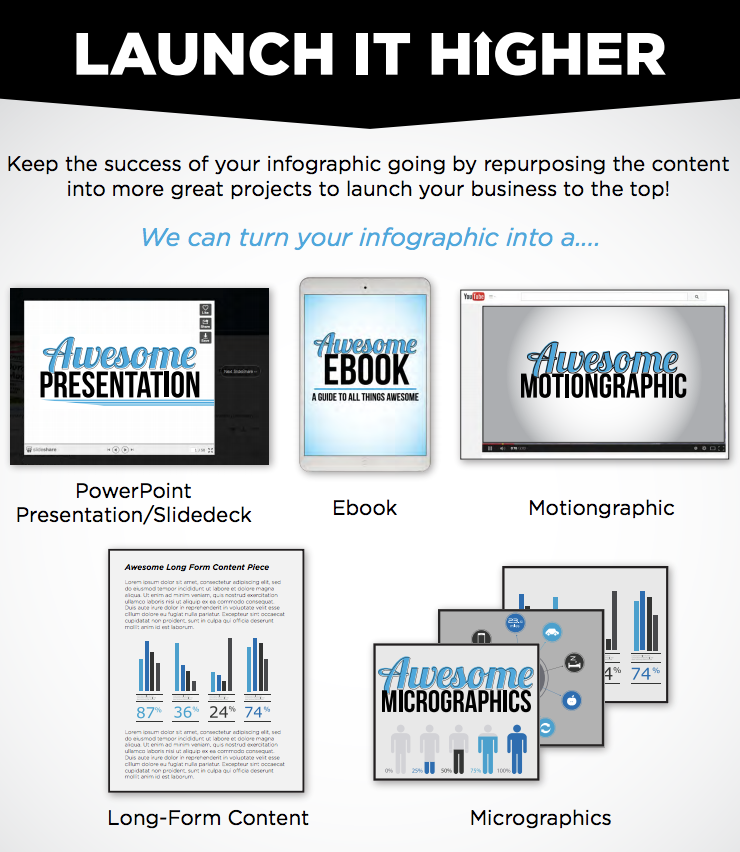
5. Repurpose – We always encourage clients to repurpose their infographic content into an ebook, video, social graphics, or long-form content article. This enables them to post on various channels to reach a bigger audience and saves them a lot of time/ budget from re-inventing the wheel and coming up with brand new content.”
This smaller infographic shows just a few repurposing options.

More Infographic Workflow Tips
Based on what Avalaunch said, we can see there are 5 main workflow steps everyone should work through. Let’s see what our participants recommend.
“Start with a plan. Pinpoint your audience, define your objective, and choose your topic. Sketch out your infographic before designing. Determine which infographic format you’ll need to use to effectively visualize your content.” — Visme
“Find an insight worth sharing. Research to find supporting data. Incorporate all of that into an infographic that resonates with your brand. Test. Revise. Publish.” — Green Rope
“Make sure your idea is original/or you are adding something new. Gather sources and do your research. Pick your key statements/facts/stats. Figure out an arrangement that balances and flows. Create, change, create, change, edit, publish!” — Dentons Digital
“Do all of your research on the topic for the infographic first. This will help you know which data points are the most important to highlight & what should be written. After putting together the infographic & content, ask for feedback!” — Netvantage Marketing
“1. Find stats, stories or processes that you find interesting. 2. Research how people talk about them & what they want to know. 3. Outline your info with short, direct points. 4. Figure out an attractive way to present your project. 5. Post it all over!” — Builder Designs
The Visme blog has a lot of articles that break down how to create infographics, how to choose a template, and how to organize information. They also have this great video on different kinds of infographics to choose from for repurposing purposes.
7 Strategies for Making Infographics More Shareable
You could have an unlimited budget for promotion, and you would still need your audience to share content. The people they share content with are a huge audience you may not have considered and might not have access to with traditional forms of promotion. So you want to give every person that comes in contact with your infographic multiple options for sharing. Let’s look at 7 valuable strategies.
1. “If you want people to share your infographic, first of all, ASK them to share it. Be sure to include social media icons in your infographic footer, create various social media sizes, and share them on your platforms. Also, provide users with a link or embed code.” — Visme
2. “Know the differences in your social media platforms. Create infographics that are sized perfectly for the platform you’re using. Make sure you have a text intro so the share or RT has some of your message included and not just on the graphic.” — Amy Hampton
3. “Include some strategic on-page text so it’s FINDable in search. I also appreciate when smaller sections are available in the right dimensions for Twitter and IG. Include bite-sized portions.” — Alexis Katherine
4. “Include a share link with pre-populated image and text formatted for each social platform. Ask for shares. Provide code for people to embed on their own websites or emails. Offer a print-ready or downloadable file.” — Nerissa Marbury
5. “Quote Influencers and tag them when you share on social! If the content is solid, they’ll share and then their following will share! Make sure the preview portion of the infographic makes sense! When they’re longer, sometimes it previews an area that is cut off or doesn’t make sense without context!” — Mark Gustafson
6. “The purpose of data is to highlight a problem. If it’s common knowledge/available elsewhere, you aren’t highlighting it and you are not illustrating a problem. People want unique, market-relevant insights.” — Ashley Ashbee
7. “It needs to be something they’re interested in and will find valuable. Make sure your infographics are actually appealing to your target audience first.” — Express Writers
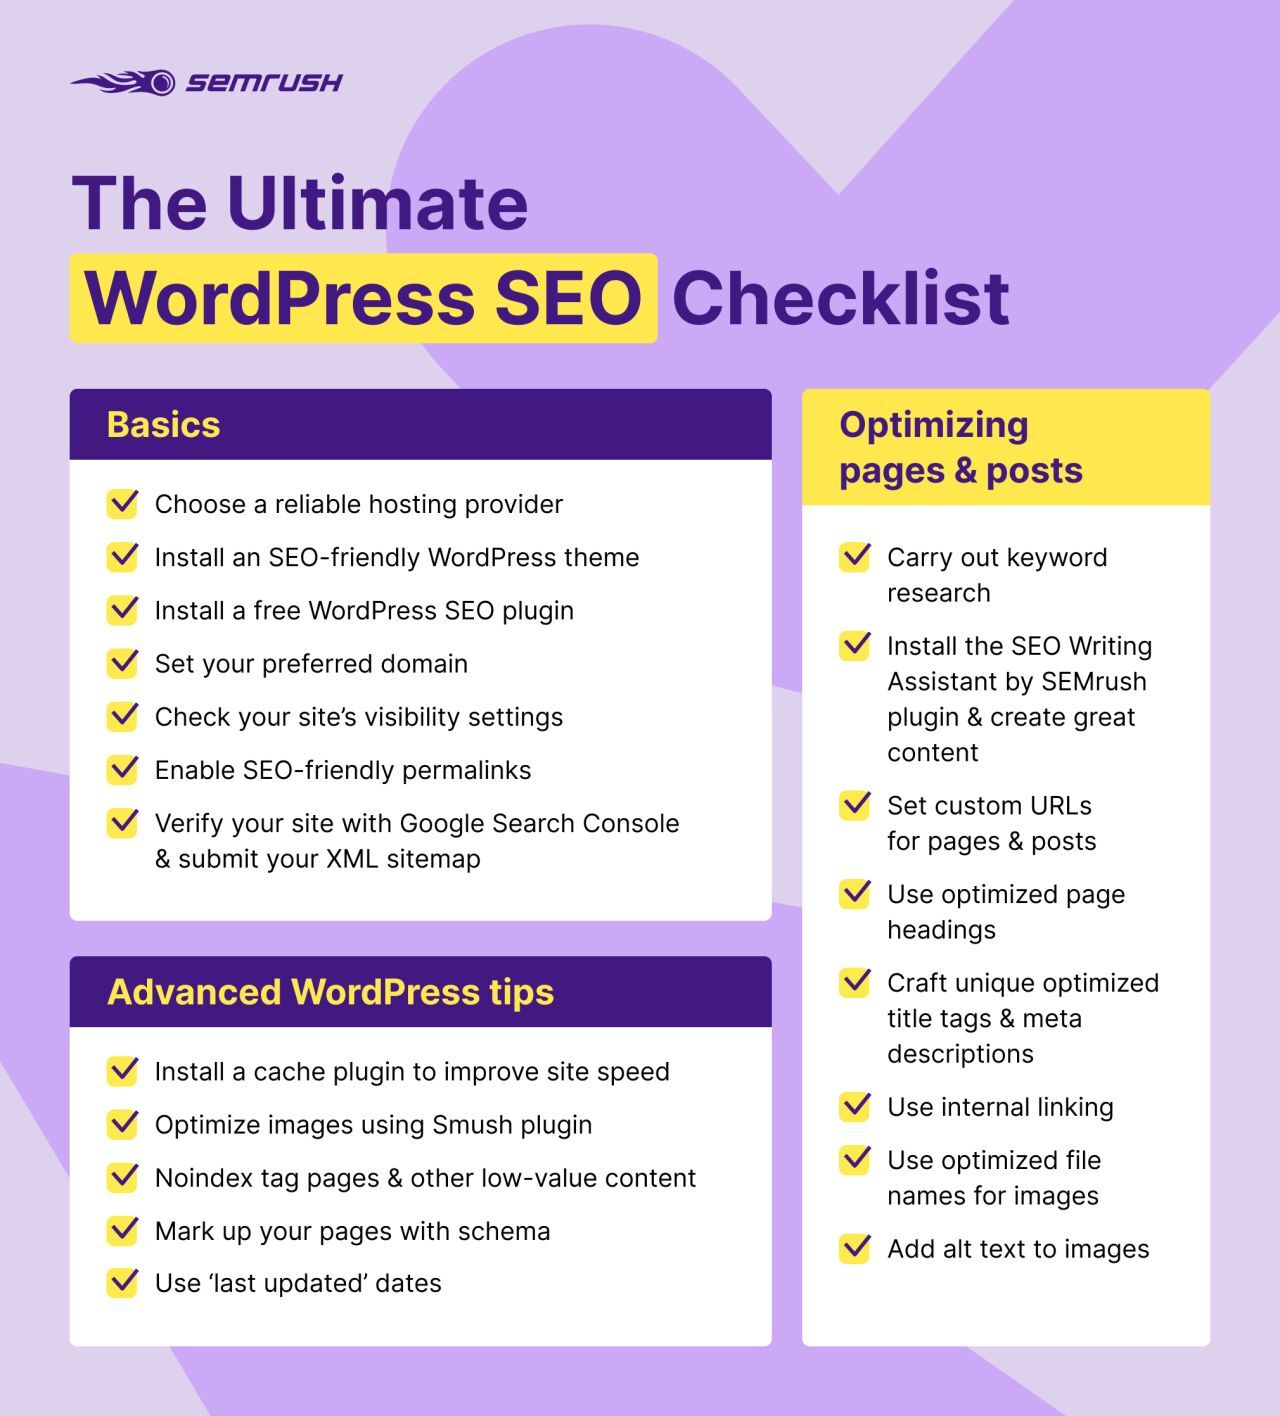
Social Media Infographic Example:
Here is an infographic that is a good example of Amy’s recommendation above on making smaller infographics that work on each platform. The SEMrush team shared on LinkedIn to promote a large WordPress guide on our site.

Infographic Tools and Platforms for Design and Marketing
There are a variety of infographic tools to use, and if you only have a small budget, there are affordable options. I know getting budget for tools can be hard, but if you can save time, you are saving money. We have an article that talks about how to afford SEO tools; most of the advice applies to any marketing tool, so check it out.
Choosing an Infographic Tool
All tools and software have a learning curve. So, you need to be prepared that something as detailed as an infographic will take some time to learn. However, some tools are more intuitive than others, and some have more templates, font choices, and design options than others.
The best way to find out which tool is best is to test them; see if there is a free trial. Also, check online reviews and watch some tutorial videos on their site or YouTube by an independent reviewer.
Make sure you choose a tool with a variety of size and customization options to repurpose larger infographics into smaller ones for social.
Suggested Infographic Tools
“Visme! Yes, we may be a little biased. We have hundreds of starter templates, color themes, free fonts, data visualization options, and more to make infographic design as easy as possible! You can download your design or embed it on your website for easy sharing.” — Visme
“Canva makes infographic design really easy. I have made quite a few in the past using their templates that you can brand to make all your own. Then, it’s all about knowing where they will perform best on social – Twitter, Pinterest, Facebook.” — Stevie Howard
“I would recommend learning Adobe PhotoShop It’s pretty user-friendly for beginners, and there are SO many tutorials online, but if you don’t have access, Canva is a good place to create them, especially if you need templates!” — Julia Rose
“1. VismeApp 2. http://Easel.ly 3. http://Visualize.me 4. Piktochart 5. Canva.” — Hardik Oza
“Photoshop/Illustrator are fantastic tools to use for both infographics and marketing. For those who may not be as versed in Adobe CC, Sketch is a fantastic and easy-to-use marketing & design tool!” — One Pitch
“There are many I have used: Piktochart, Canva, Infogram, Teambiteable, VismeApp, SnappaHQ, GoogleChartsm, and Venngage.” — Jignesh Thakkar
Do You Have Tips for Infographic Marketing?
If so, please share them in the comments below. We also want to thank all that participated in the chat. Join us every Wednesday at 11 am ET/4 pm BST for #SEMrushchat on Twitter and gain insights from some of the best marketers in the industry.
This marketing news is not the copyright of Scott.Services – please click here to see the original source of this article. Author:
For more SEO, PPC, internet marketing news please check out https://news.scott.services
Why not check out our SEO, PPC marketing services at https://www.scott.services
We’re also on:
https://www.facebook.com/scottdotservices/
https://twitter.com/scottdsmith
https://plus.google.com/112865305341039147737
The post Infographic Marketing: How to Plan, Create and Succeed appeared first on Scott.Services Online Marketing News.
source https://news.scott.services/infographic-marketing-how-to-plan-create-and-succeed/
No comments:
Post a Comment